


The Numbers Behind the Stars
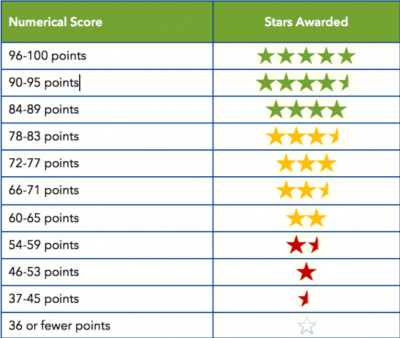
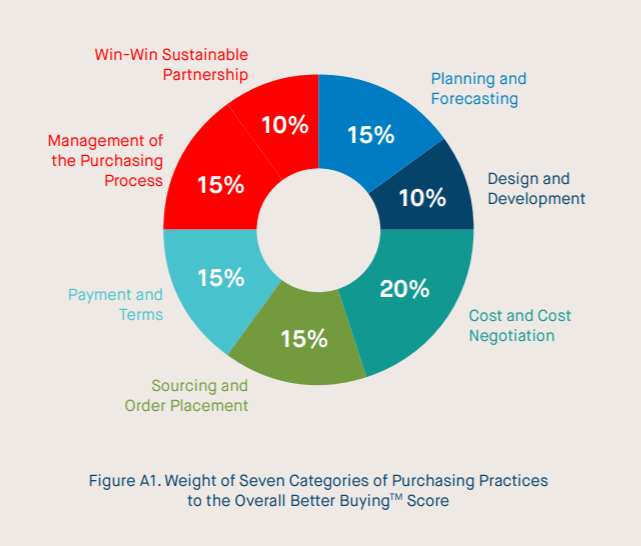
The Better Buying Purchasing Practices IndexTM uses a 0 to 100 point scoring system to calculate overall scores and scores for each category with a larger number indicating better purchasing practices. After scoring each question and category of purchasing practices with a proprietary scoring methodology, the star “grading” is applied to the scores. The same “grading standards” are applied to each category score and to the overall weighted score. The pie chart below shows how each purchasing practices category is weighted in the overall score.
Basic descriptive statistical analysis is conducted for the scores and the responses to each question. Means for the purchasing practice categories are also based on scales from 0 to 100. In all cases, smaller means reflect poorer purchasing practices while larger means reflect better purchasing practices. Standard deviation (SD) reflects the variability of scores around the mean; in this case how widely spread the buyer ratings were. A larger SD means there is quite a range of scores that have been reported about buyer purchasing practices.
Tests of differences between a buyer’s score and the industry benchmark (the average of all submitted ratings) are conducted with an independent sample t-test (the average score for all submitted ratings) to determine if there was a significant difference between the rated buyer’s scores and the benchmark. A p-value of .05 is used. P-values indicate the chance that the differences observed in data are likely due to chance. A p-value of .05 means that there is less than or equal to a 5% chance that differences reported as “significantly different” would not hold if data from all suppliers was available. Because the rated buyer’s scores are also included in the benchmark and the number of submitted ratings is relatively small, the likelihood of finding a significant difference is reduced.
The Better Buying Partnership IndexTM methodology is based on Net Promoter Score (NPS), a widely used market research metric to measure customer experience. The Partnership Index defines 3 BBPI Categories: True Partners, Collaborators, and Detractors. Suppliers score their buyer on a scale of 1-5 on 12 partnership performance questions. Each of the 12 questions track back to the BBI Five Principles of Responsible PurchasingTM.
Better BuyingTM
Calculates the % of responses scoring the buyer as a True Partner (5=All of the Time) for each question and then average the % across all the 12 questions to get a True Partners % for that buyer.
Calculates the % of responses scoring the buyer as a Collaborator (4=Often) for each question and then average the % across all the 12 questions to get a Collaborators % for that buyer.
Calculates the % of responses scoring the buyer as a Detractor (1=Never, 2=Rarely, 3=Sometimes) for each question and then average the % across all the 12 questions to get a Detractors % for that buyer.
Subtracts Detractors % from True Partners % to derive the overall BBPI Score rounded to the nearest whole number. The possible range of BBPI Score is -100 to 100, with -100 being the lowest partnership score and 100 being the highest partnership score.
The higher percentage of responses scoring the buyer as a True Partner, the better will be the buyer’s BBPI Score.
A BBPI Score closer to 100 means that the buyer’s work and use of time is efficient and non-duplicative; their partnerships with their suppliers are marked with fairness, risk-sharing, and a long-term focus.
A negative BBPI score means that higher % of responses scored the buyer as a Detractor as compared to a True Partner.
A BBPI Score closer to -100 means that the buyer’s practices reflect a primary focus on achieving their own objectives and margins (often at the expense of suppliers), and this prevents open dialogue and blinds Detractors to opportunities for shared benefit.

